The liquidity risk is defined as the lack of possibility to pay the debts on time due to the lack of liquid assets. Lack of liquidity may arise from inappropriate structure of statement of financial position, misfit of cash flows, not received payments from contractors, sudden withdrawal of cash by clients or other market events.
The objective of liquidity risk management is to pay present and future debts (also potential) on time, taking into account the nature of performed activities and requirements which may occur due to changes in market environment, by shaping the structure of statement of financial position and off-balance sheet liabilities.
The Group’s policy concerning liquidity is based on keeping a portfolio of liquid securities and increasing stable sources of financing (stable deposits, in particular). In its liquidity risk management policy, also uses money market instruments, including NBP open market operations.
52.1. Measurement of the liquidity risk
The Group makes use of the following liquidity risk measures:
- the contractual liquidity gap method and the liquidity gap in real terms,
- liquidity reserve,
- measure of stability of deposit and loan portfolios,
- stress tests (liquidity stress tests).
52.2. Forecasting and monitoring of liquidity risk
Liquidity gaps presented below include the sum of Bank’s adjusted liquidity gap (adjusted in terms of the following: core balances on deposits of non-financial sector and their maturity, core balances on loans in current accounts for non-financial entities and their maturity and liquid securities and their maturity) and contractual liquidity gap of other Group entities.
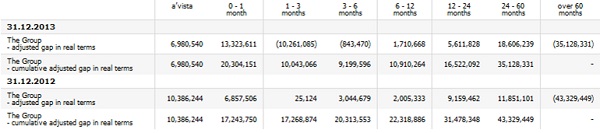
In all time horizons, the Group’s cumulative adjusted liquidity gap in real terms , which has been determined as a sum of adjusted gap in real terms and contractual liquidity gaps of the remaining entities of the Group, as at 31 December 2013 and as at 31 December 2012 was positive. This means a surplus of assets receivable over liabilities payable.
The table below presents liquidity reserve of the Bank as at 31 December 2013 and as at 31 December 2012:
| Name of sensitivity measure | 31.12.2013 | 31.12.2012 |
|---|---|---|
| Liquidity reserve up to 1 month* (in PLN million) | 17,816 | 13,568 |
*Liquidity reserve equals the gap between the most liquid assets and expected and potential liabilities which mature in a given period of time.
As at 31 December 2013 the level of core balances on deposits constituted approx. 95.9% of all deposits in the Bank (excluding interbank market), which means an increase by approximately 2.6 pp. as compared to the end of 2012.
The chart below presents the structure of the Bank's sources of financing as at 31 December 2013 and as at 31 December 2012.
52.3. The contractual flows of the Group’s liabilities excluding derivative financial instruments as at 31 December 2013 and as at 31 December 2012 respectively, by maturity.
The tables below show the contractual maturity analysis presenting the outstanding contractual maturity dates by individual categories of balance sheet and off-balance sheet liabilities, excluding derivative financial instruments as at 31 December 2013 and as at 31 December 2012 respectively.
The amounts denominated in foreign currencies have been translated using the average NBP exchange rate as at 31 December 2013 and as at 31 December 2012. The amounts disclosed comprise non-discounted future flows, both in respect of principal and interest (if applicable), in accordance with the contract, for the entire period to the date of the liability's maturity. In situations where the party to whom the Group has a liability is able to select the settlement deadline, it has been assumed that the earliest date on which the Group is obliged to settle the liability shall be taken into account. In situations where the Group is obliged to settle the liabilities in instalments, each instalment is allocated to the earliest period in which the Group might be obligated to settle. In the case of liabilities where the instalment date is not fixed, the terms binding as at the reporting date have been adopted.


52.4. The contractual flows related to derivative financial instruments as at 31 December 2013 and as at 31 December 2012 respectively, by maturity dates
Derivative financial instruments settled in net amounts
Derivative financial instruments settled by the Group on a net basis include:
- interest rate swaps (IRS),
- Forward Rate Agreements (FRA),
- Non Deliverable Forwards (NDF),
- options.
The tables below show the contractual maturity analysis presenting the outstanding contractual maturity dates by individual categories of derivative financial instruments in respect of which the balance date valuation was negative (a liability) as at 31 December 2013 and as at
31 December 2012 respectively.
The amounts denominated in foreign currencies have been translated using the average NBP exchange rate as at 31 December 2013 and as at 31 December 2012. In case of IRS transactions, non-discounted future net cash flows in respect of interest have been presented and in case of the remaining derivative instruments settled on a net basis, the amount of the valuation as at 31 December 2013 and as at 31 December 2012 respectively was adopted as the value of cash flows.
Moreover, in the table the cash flows from IRS transactions which constitute cash flow hedges in respect of loans with variable interest rates are shown separately.
| 31 December 2013 | Up to 1 month | 1 - 3 months | 3 months - 1 year | 1 - 5 years | Over 5 years | Contractual value |
|---|---|---|---|---|---|---|
| Derivative financial instruments - liabilities: | ||||||
| - Interest Rate Swap (IRS) transactions, of which: | 90,370 | (57,992) | 111,747 | 111,310 | (10,916) | 244,519 |
| - derivative hedging instruments | 49,757 | 14,229 | 48,532 | 150,395 | - | 262,913 |
| - other derivative hedging instruments: options, FRA, NDF | (41,165) | (8,319) | (48,048) | (41,165) | - | (138,697) |
| 31 December 2012 | Up to 1 month | 1 - 3 months | 3 months - 1 year | 1 - 5 years | Over 5 years | Contractual value |
|---|---|---|---|---|---|---|
| Derivative financial instruments - liabilities: | ||||||
| - Interest Rate Swap (IRS) transactions, of which: | (23,128) | (277,200) | (535,706) | (742,846) | (86,351) | (1,665,231) |
| - derivative hedging instruments | - | (534) | 24 | (1,023) | - | (1,533) |
| - other derivative hedging instruments: options, FRA, NDF | (5,871) | (9,398) | (129,056) | (45,167) | - | (189,492) |
Derivative financial instruments settled in gross amounts
Derivative financial instruments settled by the Group on a gross basis include:
- foreign currency swaps,
- foreign currency forwards,
- Cross Currency IRS (CIRS).
The tables below show the contractual maturity analysis, presenting the outstanding contractual maturity dates by individual categories of derivative financial instruments (inflows and outflows) in respect of which the balance date valuation was negative (a liability) as at
31 December 2013 and as at 31 December 2012 respectively. The amounts denominated in foreign currencies have been translated using the average NBP rate as at 31 December 2013 and as at 31 December 2012. The amounts disclosed comprise non-discounted future cash flows, both in respect of principal and interest (if applicable).
In the table below cash flows from CIRS transactions which constitute cash flow hedges in respect of mortgage loans denominated in CHF and deposits negotiated in PLN are shown separately.
| 31 December 2013 | Up to 1 month | 1 - 3 months | 3 months - 1 year | 1 - 5 years | Over 5 years | Contractual value |
|---|---|---|---|---|---|---|
| Derivative financial instruments: | ||||||
| - outflows, of which: | (1,849,706) | (450,043) | (1,495,046) | (3,028,734) | (1,071,151) | (7,894,680) |
| - derivative hedging instruments | (9,510) | (104,562) | (76,941) | (762,546) | (799,481) | (1,753,040) |
| - inflows, of which: | 2,667,156 | 660,715 | 1,277,266 | 4,458,373 | 1,601,828 | 10,665,338 |
| - derivative hedging instruments | 16,525 | 376,723 | 249,269 | 2,611,406 | 1,320,615 | 4,574,538 |
| 31 December 2012 | Up to 1 month | 1 - 3 months | 3 months - 1 year | 1 - 5 years | Over 5 years | Contractual value |
|---|---|---|---|---|---|---|
| Derivative financial instruments: | ||||||
| - outflows, of which: | (2,350,423) | (1,591,595) | (5,724,512) | (3,204,947) | (379,212) | (13,250,689) |
| - derivative hedging instruments | (6,951) | (233,496) | (960,036) | (1,003,916) | (103,629) | (2,308,028) |
| - inflows, of which: | 2,297,344 | 1,682,011 | 6,008,299 | 5,019,833 | 658,357 | 15,665,844 |
| - derivative hedging instruments | 34,379 | 256,053 | 2,618,093 | 3,280,754 | 73,846 | 6,563,125 |
52.5. Current and non-current assets and liabilities
31 December 2013
| Short-term | Long-term | Impairment allowances | Total carrying amount | |
|---|---|---|---|---|
| Assets | ||||
| Cash and balances with the central bank | 7,246,120 | - | - | 7,246,120 |
| Amounts due from banks | 1,827,492 | 94,532 | (28,583) | 1,893,441 |
| Trading assets | 479,881 | - | - | 479,881 |
| Derivative financial instruments | 822,349 | 2,178,511 | - | 3,000,860 |
| Financial assets designated upon initial recognition at fair value through profit and loss | 14,186,661 | 1,018,095 | - | 15,204,756 |
| Loans and advances to customers | 41,294,317 | 114,979,725 | (6,650,780) | 149,623,262 |
| Investment securities available for sale | 698,501 | 13,408,032 | (33,455) | 14,073,078 |
| Securities held to maturity | 18,314 | 19,691 | - | 38,005 |
| Inventories | 425,298 | 278,148 | (53,805) | 649,641 |
| Other assets | 2,199,584 | 5,628,201 | (805,719) | 7,022,066 |
| Total assets | 69,198,517 | 137,604,935 | (7,572,342) | 199,231,110 |
| Liabilities | ||||
| Amounts due to the central bank | 4,065 | - | - | 4,065 |
| Amounts due to banks | 2,279,311 | 1,468,026 | - | 3,747,337 |
| Derivate financial instruments | 1,065,920 | 2,262,291 | - | 3,328,211 |
| Amounts due to customers | 135,360,982 | 16,543,199 | - | 151,904,181 |
| Debt securities in issue | 1,383,963 | 9,162,483 | - | 10,546,446 |
| Subordinated liabilities | - | 1,620,857 | - | 1,620,857 |
| Other liabilities | 2,749,043 | 176,645 | - | 2,925,688 |
| Total liabilities | 142,843,284 | 31,233,501 | - | 174 076 785 |
| Equity | - | 25,154,325 | - | 25,154,325 |
| Total liabilities and equity | 142,843,284 | 56,387,826 | - | 199,231,110 |
31 December 2012 restated
| Short-term | Long-term | Impairment allowances | Total carrying amount | |
|---|---|---|---|---|
| Assets | ||||
| Cash and balances with the central bank | 10,289,451 | - | - | 10,289,451 |
| Amounts due from banks | 3,417,883 | 3,985 | (29,382) | 3,392,486 |
| Trading assets | 277,566 | - | - | 277,566 |
| Derivative financial instruments | 1,138,254 | 2,722,307 | - | 3,860,561 |
| Financial assets designated upon initial recognition at fair value through profit and loss | 11,050,957 | 1,578,754 | - | 12,629,711 |
| Loans and advances to customers | 39,611,445 | 110,647,886 | (6,776,265) | 143,483,066 |
| Investment securities available for sale | 918,134 | 11,310,239 | (23,243) | 12,205,130 |
| Investment securities held to maturity | 19,498 | 27,473 | - | 46,971 |
| Inventories | 551,302 | 33,736 | (31,504) | 553,534 |
| Other assets | 2,147,806 | 4,681,824 | (417,431) | 6,412,199 |
| Total assets | 69,422,296 | 131,006,204 | (7,277,825) | 193,150,675 |
| Liabilities | ||||
| Amounts due to the central bank | 3,128 | - | - | 3,128 |
| Amounts due to banks | 1,691,722 | 2,042,225 | - | 3,733,947 |
| Derivative financial instruments | 1,276,016 | 2,688,082 | - | 3,964,098 |
| Amounts due to customers | 134,488,990 | 11,704,580 | - | 146,193,570 |
| Debt securities in issue | 995,044 | 9,275,739 | - | 10,270,783 |
| Subordinated liabilities | - | 1,631,256 | - | 1,631,256 |
| Other liabilities | 2,357,801 | 559,684 | - | 2,917,485 |
| Total liabilities | 140,812,701 | 27,901,566 | - | 168,714,267 |
| Equity | - | 24,436,408 | - | 24,436,408 |
| Total liabilities and equity | 140,812,701 | 52,337,974 | - | 193,150,675 |
1 January 2012 restated
| Short-term | Long-term | Impairment allowances | Total carrying amount | |
|---|---|---|---|---|
| Assets | ||||
| Cash and balances with the central bank | 9,142,168 | - | - | 9,142,168 |
| Amounts due from banks | 2,425,344 | 3,695 | (32,812) | 2,396,227 |
| Trading assets | 638,321 | 672,768 | - | 1,311,089 |
| Derivative financial instruments | 1,304,726 | 1,760,007 | - | 3,064,733 |
| Financial assets designated upon initial recognition at fair value through profit and loss | 11,666,896 | 800,305 | - | 12,467,201 |
| Loans and advances to customers | 37,254,731 | 109,658,001 | (5,658,243) | 141,254,489 |
| Investment securities available for sale | 2,116,703 | 12,297,136 | (20,563) | 14,393,276 |
| Inventories | 493,481 | 106,453 | (33,088) | 566,846 |
| Other assets | 1,626,436 | 4,636,471 | (417,434) | 5,845,473 |
| Total assets | 66,668,806 | 129,934,836 | (6,162,140) | 190,441,502 |
| Liabilities | ||||
| Amounts due to the central bank | 3,454 | - | - | 3,454 |
| Amounts due to banks | 5,513,385 | 725,779 | - | 6,239,164 |
| Derivative financial instruments | 883,657 | 1,761,624 | - | 2,645,281 |
| Amounts due to customers | 141,686,933 | 4,786,964 | - | 146,473,897 |
| Debt securities in issue | 3,160,479 | 4,611,300 | - | 7,771,779 |
| Subordinated liabilities | - | 1,614,377 | - | 1,614,377 |
| Other liabilities | 3,102,852 | 81,928 | - | 3,184,780 |
| Total liabilities | 154,350,760 | 13,581,972 | - | 167,932,732 |
| Equity | - | 22,508,770 | - | 22,508,770 |
| Total liabilities and equity | 154,350,760 | 36,090,742 | - | 190,441,502 |
52.6. Reporting of the liquidity risk
The Bank prepares daily, weekly, monthly, and quarterly reports addressing liquidity risk. The quarterly reports are also applicable to the Group. Reports present the information on liquidity risk exposure and usages of available limits regarding the risk.
52.7. Management decisions concerning liquidity risk
The main tools for liquidity risk management in the PKO Bank Polski SA Group are as follows:
- procedures for liquidity risk management, in particular emergency plans,
- limits and thresholds mitigating liquidity risk,
- deposit, investment and derivative transactions, including structural currency transactions and transactions for sale or purchase of securities,
- transactions ensuring long-term financing of Bank’s lending activities.
To ensure an adequate liquidity level, the Bank and subsidiaries of the PKO Bank Polski SA Group have accepted limits and thresholds for liquidity risk. The limits and thresholds were set for current liquidity measures , medium and long-term liquidity measures.
Methods of liquidity risk management in subsidiaries of the Group are defined by internal regulations implemented by the Group entities which are characterised by high levels of liquidity risk measure outcomes.
These regulations are developed after consultation with the Bank and take into account recommendations issued by the Bank to the entities.